

Documentation
Alerts and ingest
An alert is one problem that needs a person. This page covers how alerts come in, how repeats of the same problem are folded into one, what an alert’s life looks like, who may change it, and what the dashboard computes from all of them.
Sending an alert
Every alert is one HTTP POST to the team’s address. The credential is the team’s integration key, created under the team’s Integration keys tab in the console. It goes in the Authorization header as is, with no Bearer or other prefix. A key behind the wrong prefix is a 403, and a key in any other header is a 401.
curl -X POST https://api.igniteops.io/v1/organizations/{org}/incident-management/{team}/alerts \
  -H "Authorization: ign_xxxxxxxxxxxxxxxxxxxxxxxxxxxxxxxx" \
  -H "Content-Type: application/json" \
  -d '{
    "title": "Database connection pool exhausted on prod-db-01",
    "message": "PgBouncer reports 100% pool utilisation for 5 minutes. API latency p99 is above 4 s.",
    "source": "datadog",
    "severity": "P1",
    "alias": "db-pool-exhausted",
    "entity": "prod-db-01",
    "alert_url": "https://app.datadoghq.com/monitors/12345",
    "tags": { "env": "production", "service": "postgres" },
    "custom_fields": { "runbook": "https://wiki.example.com/runbooks/pgbouncer" }
  }'
The answer is a 201 with the alert as stored. Two fields are worth reading: routing says whether the routing rules and the escalation policy were started (started) or whether the alert was stored without paging anyone (suppressed, with a routing_reason of quota_exceeded or team_disabled), and on the Free plan quota carries the month’s counter.
HTTP/1.1 201 Created
{
  "alert_id": "0f1d2c3b-4a5e-4f60-9b7c-8d9e0f1a2b3c",
  "title": "Database connection pool exhausted on prod-db-01",
  "severity": "P1",
  "status": "open",
  "source": "datadog",
  "alias": "db-pool-exhausted",
  "count": 1,
  "routing": "started",
  "quota": { "plan": "free", "used": 12, "limit": 100, "resets_at": "2026-12-01T00:00:00.000Z" },
  "href": "https://api.igniteops.io/v1/organizations/acme/incident-management/platform/alerts/0f1d2c3b-…",
  "created_at": "2026-11-08T03:07:11.412Z"
}
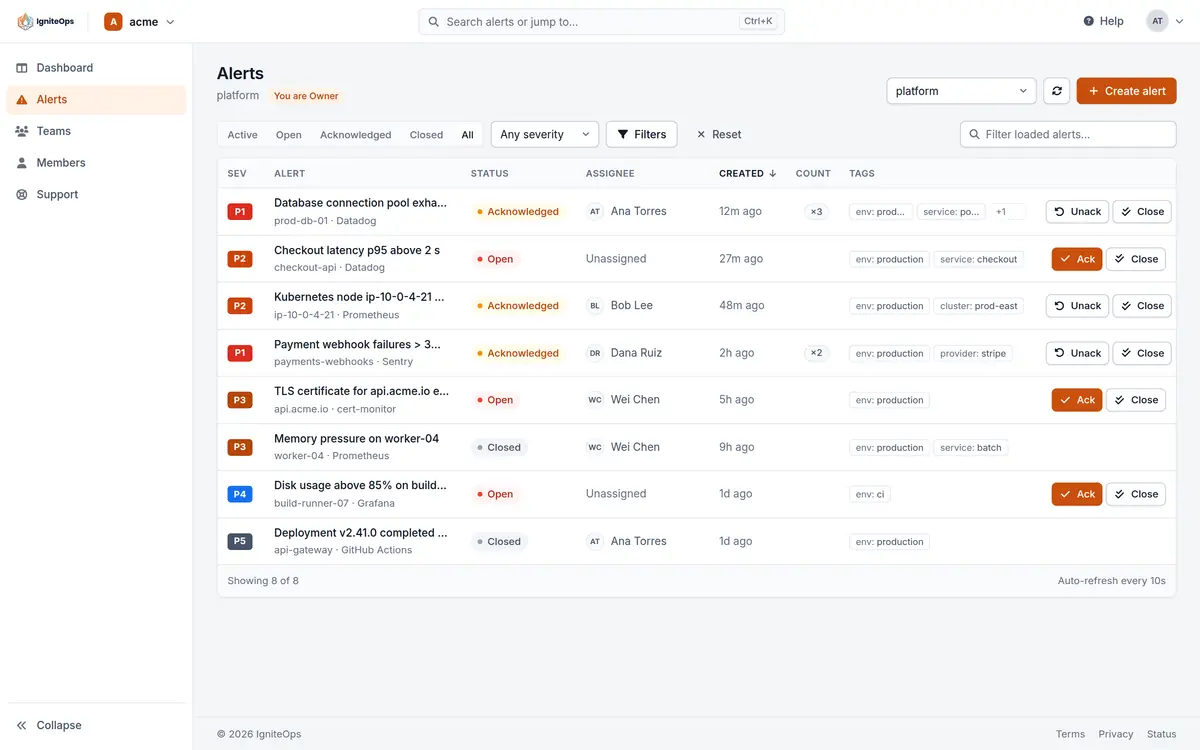
A signed-in person can create an alert too: the Create alert button in the console and in the mobile app, for any team of the organization, whatever their team role. Such an alert carries source: manual and is routed and escalated exactly like one from a webhook, which makes it the easiest way to exercise a new routing rule or policy.
The fields
Only title and message are required. Text longer than a field’s limit is clipped to it and the alert is still created: an alert from a monitoring tool must page someone even when its description is long.
| Field | Type | Rule |
|---|---|---|
| titlerequired | string | What happened, in one line. Up to 500 characters. |
| messagerequired | string | The detail the responder needs. Up to 10,000 characters. Shown as the body of the push notification and the email. |
| source | string | Where it came from, up to 256 characters. Left out, it is the integration key’s name for a webhook alert and manual for one created by a person. Routing rules can match on it. |
| severity | P1 | P2 | P3 | P4 | P5 | P1 is the most urgent. P3 when left out. See Severity below. |
| alias | string | Up to 256 characters. Repeats with the same alias update the existing open alert instead of creating a new one. See Deduplication below. |
| entity | string | The thing affected (a host, a service, a queue), up to 256 characters. Shown on the alert and matchable by rules. |
| alert_url | string | A link back to the tool that raised the alert, http or https, up to 2,048 characters. Anything else is dropped. |
| tags | object | Up to 50 key-value pairs. Keys up to 100 characters (longer keys are dropped), values clipped to 500 and stored as text. Routing rules match them as tags.<key>, and the alerts list filters by them. |
| custom_fields | object | Up to 50 entries with any JSON value, keys up to 100 characters. Beyond 20,000 characters of JSON the whole map is replaced by { "_truncated": true }. Routing rules match them as custom_fields.<key>. |
| assignee | string | The user id of a member of the organization to assign the alert to. An alert created by a person is assigned to its creator unless this is null. An integration key assigns nobody by default. |
Deduplication by alias
A monitor that fires every minute would create sixty alerts an hour and page the team sixty times. Send an alias with the alert, a stable name for the condition such as db-pool-exhausted or the monitor’s own id, and the repeats fold into one alert.
- A request whose alias matches an alert that is open or acknowledged is answered
200withdeduplicated: true. The alert’scountgoes up by one and its last-occurrence time is updated. Nothing new is created, and the repeat never counts against the monthly quota. - If that alert is open and no escalation is running for it any more (every step has fired, or the policy had no repeat), the repeat starts the routing again, so a problem that comes back after the team stopped being paged pages them again.
- An alias that only matches a closed alert creates a new alert. A closed alert never absorbs new occurrences.
- There is no time window. The alias is compared against the alerts of that team, whatever their age, until they are closed.
HTTP/1.1 200 OK
{
  "alert_id": "0f1d2c3b-4a5e-4f60-9b7c-8d9e0f1a2b3c",
  "deduplicated": true,
  "count": 2,
  "status": "open",
  "routing": "started"
}
Severity
Five levels, named in the console as Critical, High, Medium, Low and Info. The severity decides the wording of the notifications (the push title starts with 🚨 CRITICAL:, the SMS with IgniteOps CRITICAL:, and so on for the other levels), it is the most common field a routing rule matches on, and it can be changed on the alert afterwards from the Properties panel.
| Severity | Name in the console | Typical use |
|---|---|---|
| P1 | Critical | Production is down or data is at risk. Route to a policy that calls people. |
| P2 | High | A customer-facing degradation. Page the on-call now, escalate within minutes. |
| P3 | Medium | The default. Something needs attention during the shift. |
| P4 | Low | Can wait for business hours. Many teams route these to an email step only. |
| P5 | Info | A record for the timeline and the metrics rather than a page. |
There is no separate priority field. A rule that tries to match priority or status is refused when it is saved.
The life of an alert
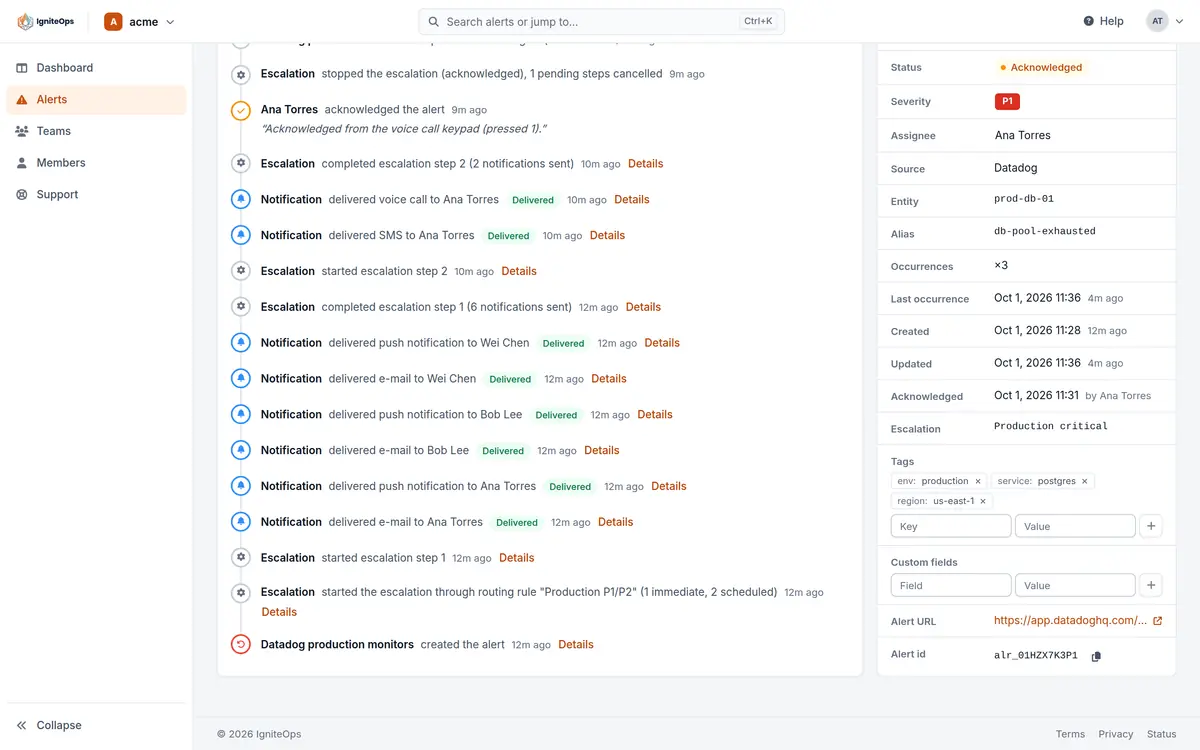
An alert is open, acknowledged or closed. There is no other state. Acknowledging stops the escalation and assigns the alert to the person who acknowledged it. Closing records that the problem is over. A closed alert can be reopened, and an acknowledged one can be unacknowledged, which reopens it and removes the assignee.
- Acknowledge, Unack, Close and Reopen each take an optional note of up to 2,000 characters, which goes on the timeline.
- Comments are Markdown (paragraphs, lists, code, links, tables), up to 5,000 characters, and can be edited and deleted.
- Properties: the source, the entity, the alias, the occurrence count, who acknowledged and closed it, the escalation that ran, the tags, the custom fields and the link to the tool.
- The timeline records every routing decision, every notification with its delivery status, every acknowledgement and where it came from, and every comment, filterable by kind.
Who may do what follows the team role: Owners, Managers and Responders acknowledge, close, comment and change an alert, Observers read. The roles page has the whole matrix. Through the API, PUT on the alert changes status, assignee, severity, tags, custom_fields and notes, with an optional expected_updated_at so two people editing at once cannot overwrite each other.
Ways to acknowledge
| From | How | Notes |
|---|---|---|
| The phone call | Press 1 on the keypad. Press 2 to escalate to the next step at once. | The call reads the title aloud and repeats the prompt once. |
| The email | The Acknowledge button or link. | A one-time link that needs no sign-in, valid for 24 hours and tied to the person it was sent to. |
| The push notification | The Acknowledge or Close button on the notification. | iOS and Android apps. |
| The console or the app | The Acknowledge button on the alert. | With an optional note. |
| The API | POST …/alerts/{alertId}/ack | With a personal API key (PAT) or a signed-in session, never with an integration key. |
| An SMS | Not possible. | The SMS carries no link and no reply is read. It is the shortest path to the call or the app. |
curl -X POST https://api.igniteops.io/v1/organizations/{org}/incident-management/{team}/alerts/{alertId}/ack \
  -H "Authorization: PAT <your personal API key>"
Quota and limits
On the Free plan a team may route 100 alerts a calendar month, counted in UTC. Beyond that, alerts are still stored and visible, the sender still gets a 201 with routing: suppressed and an X-IgniteOps-Quota header, and nobody is paged until the counter resets or the organization upgrades. The owner is emailed at 80% and at 100%. Repeats absorbed by an alias never count. Free organizations may also send at most 30 alerts a minute and 1,000 a day. Beyond that the API answers 429 with a Retry-After.
On Pro every alert is routed. The first 100 each month are included and each one after that is $0.10.
| Limit | Free | Pro |
|---|---|---|
| Alerts routed per month | 100 | 100 included, then $0.10 each |
| Ingest rate per organization | 30 a minute, 1,000 a day (429 beyond) | Not enforced |
| Alias deduplication | Yes | Yes |
| Title / message / source | 500 / 10,000 / 256 characters, clipped | The same |
| Tags / custom fields | 50 each | The same |
During a service disruption
An alert that arrives during a service disruption is still accepted and paged. Its answer carries degraded: true and no quota, and the alert appears in the list once the service recovers. Acknowledgements, updates and closes made during the disruption answer 503 with a Retry-After of 30 seconds and should be retried.
Metrics
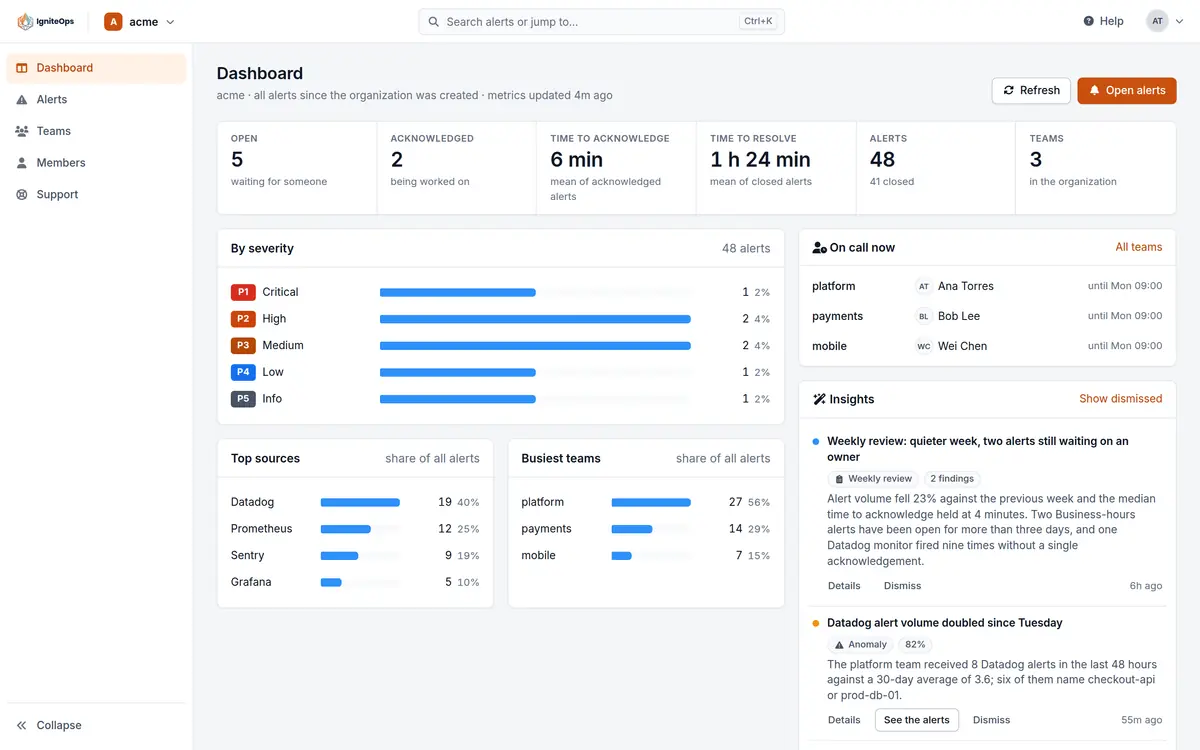
The dashboard shows, for the organization and for each team: open and acknowledged alerts, the mean time to acknowledge (MTTA) and time to resolve (MTTR), the alerts by severity, the top sources and the busiest teams, all over the whole history. The numbers are recalculated in the background, so a brand-new organization sees them after the first run, and a figure older than an hour is flagged as stale.
On Pro, a weekly review is written from the same data: findings, what to do next, and the evidence tables behind them (this week against last, MTTA median and 90th percentile, MTTR median, the noisiest alerts, duplicate storms, escalation and on-call coverage, the backlog). Hourly insights point out patterns, anomalies and recommendations, and each can be dismissed for 30 days.
Checked against the product on November 8, 2026.